Steel-manning the AI Story: Growth Accounting and Solving Baumol

"The primary test of economic progress for a nation is its ability to produce increasing quantities of goods and services with a given quantity of labor and capital." – Warren Buffet
“There is not much that even the most socially responsible scientists can do as individuals, or even as a group, about the social consequences of their activities.” – Eric Hobsbawm
"You can see the computer age everywhere but in the productivity statistics," quipped the economist Robert Solow in 1987. Many people would say the same thing about AI today (and as of this week, they would be wrong). And yet, I could not overstate the extent to which AI's transformative impact (principally in its large language model (LLM) form) on our world over the next twenty years is taken for granted among the founders, fellow venture capitalists, and institutional investors I spend time with (I am a firm believer that this technology is the "killer app" for the IT super-cycle which began more than 60 years ago and will dominate how subsequent generations understand the next decades).
The forms this may take and its macroeconomic consequences are manifold. Will AI automate all knowledge work creating a pauperized cohort of educated urbanites who will join the 1917 club and take to the office parks of Silicon Valley? Will it be deflationary as the cost of legal, financial, and digital health services asymptotes towards zero? Will productivity gains usher in an investment and growth boom a la the 1920s? Barring AI liftoff (where recursively improving AI systems solve math, science, engineering, and all work), what will actually have to happen in the real economy to justify investor enthusiasm?
What follows may be the first (I cannot answer for my caprices) of multiple essays describing the possible economic consequences of the proliferation of AI technology and how the market might tip its hand to show us which future we'll be living in starting with the "AI is electricity" version.
This is an optimistic version of the AI story in which America enjoys real GDP growth averaging 3.25% over the next two decades, doubling the economy and increasing GDP per capita by over 75%.
Where Does Growth Come From? (A Brief Primer)
We begin with the Cobb-Douglas production function with total factor productivity (goodbye both of my readers):
Y = A · K^α · L^(1-α)
Where Y is output (GDP), K is capital input, L is labor input, and A is Total Factor Productivity (the unexplained variable that accounts for how we achieve more output with the same capital and labor). The parameter α represents the output elasticity of capital in economicese or the portion of income paid to capital (machines, structures, and software). This parameter is not fixed but assume it is roughly 1/3 in the United States, which implies that labor captures the remaining 2/3 of GDP.
Deriving with respect to output we get:
ΔY/Y = ΔA/A + α(ΔK/K) + (1-α)(ΔL/L)
With α = 1/3, this produces:
- 10% more capital → 3.3% more output
- 10% more labor → 6.7% more output
- 10% more productivity → 10% more output
The important takeaways are that (1) productivity gains face no diminishing returns to scale (2) labor's returns to output diminish more slowly than capital and (3) both labor and capital hit walls when oversupplied. This is why transformative general purpose technologies show up in productivity not as a mere capital accumulation.
What Actually Happened During Electrification
The electric dynamo was a viable alternative to water or steam power by the 1880s but did not initially show up in the productivity statistics either. In the steam era, power was generated by a central engine and distributed through the factory via a complex, dangerous, and inefficient network of belts and pulleys which dictated that machines needed to be as close as possible to the central power source (hence why when one drives through 19th century industrial towns in New England like Lowell, Manchester, Merrimack, and Lawrence, the old factories are five stories tall). When electricity first entered the factory, it was deployed in the same configuration. This substitution saved cost on coal and improved cleanliness but it did not fundamentally alter the production process, for 30 years!
Manufacturing productivity growth exploded from less than a percent (0.71%) annually from 1889-1919 to 5.12% in the 20's with the shift to "unit drive", the instillation of smaller, individual electric motors directly onto each machine. Electric motors were able to be placed anywhere in the factory (thus removing the constraint of organizing production around power transmission rather than the workflow) which is why as you move west to Michigan and Ohio, factories are laid out on one floor, with systems of cranes moving equipment and products along an assembly line. Electric motors also led to the creation of powered hand tools which could be operated synergistically on an assembly line. The immediate and obvious scale of the efficiency gains are made clear by the order of magnitude increase in the size of the real estate footprints of one-story factories (even though the population was larger and more concentrated so land presumably more scarce). The productivity gains came from reorganization, not from plugging things in.
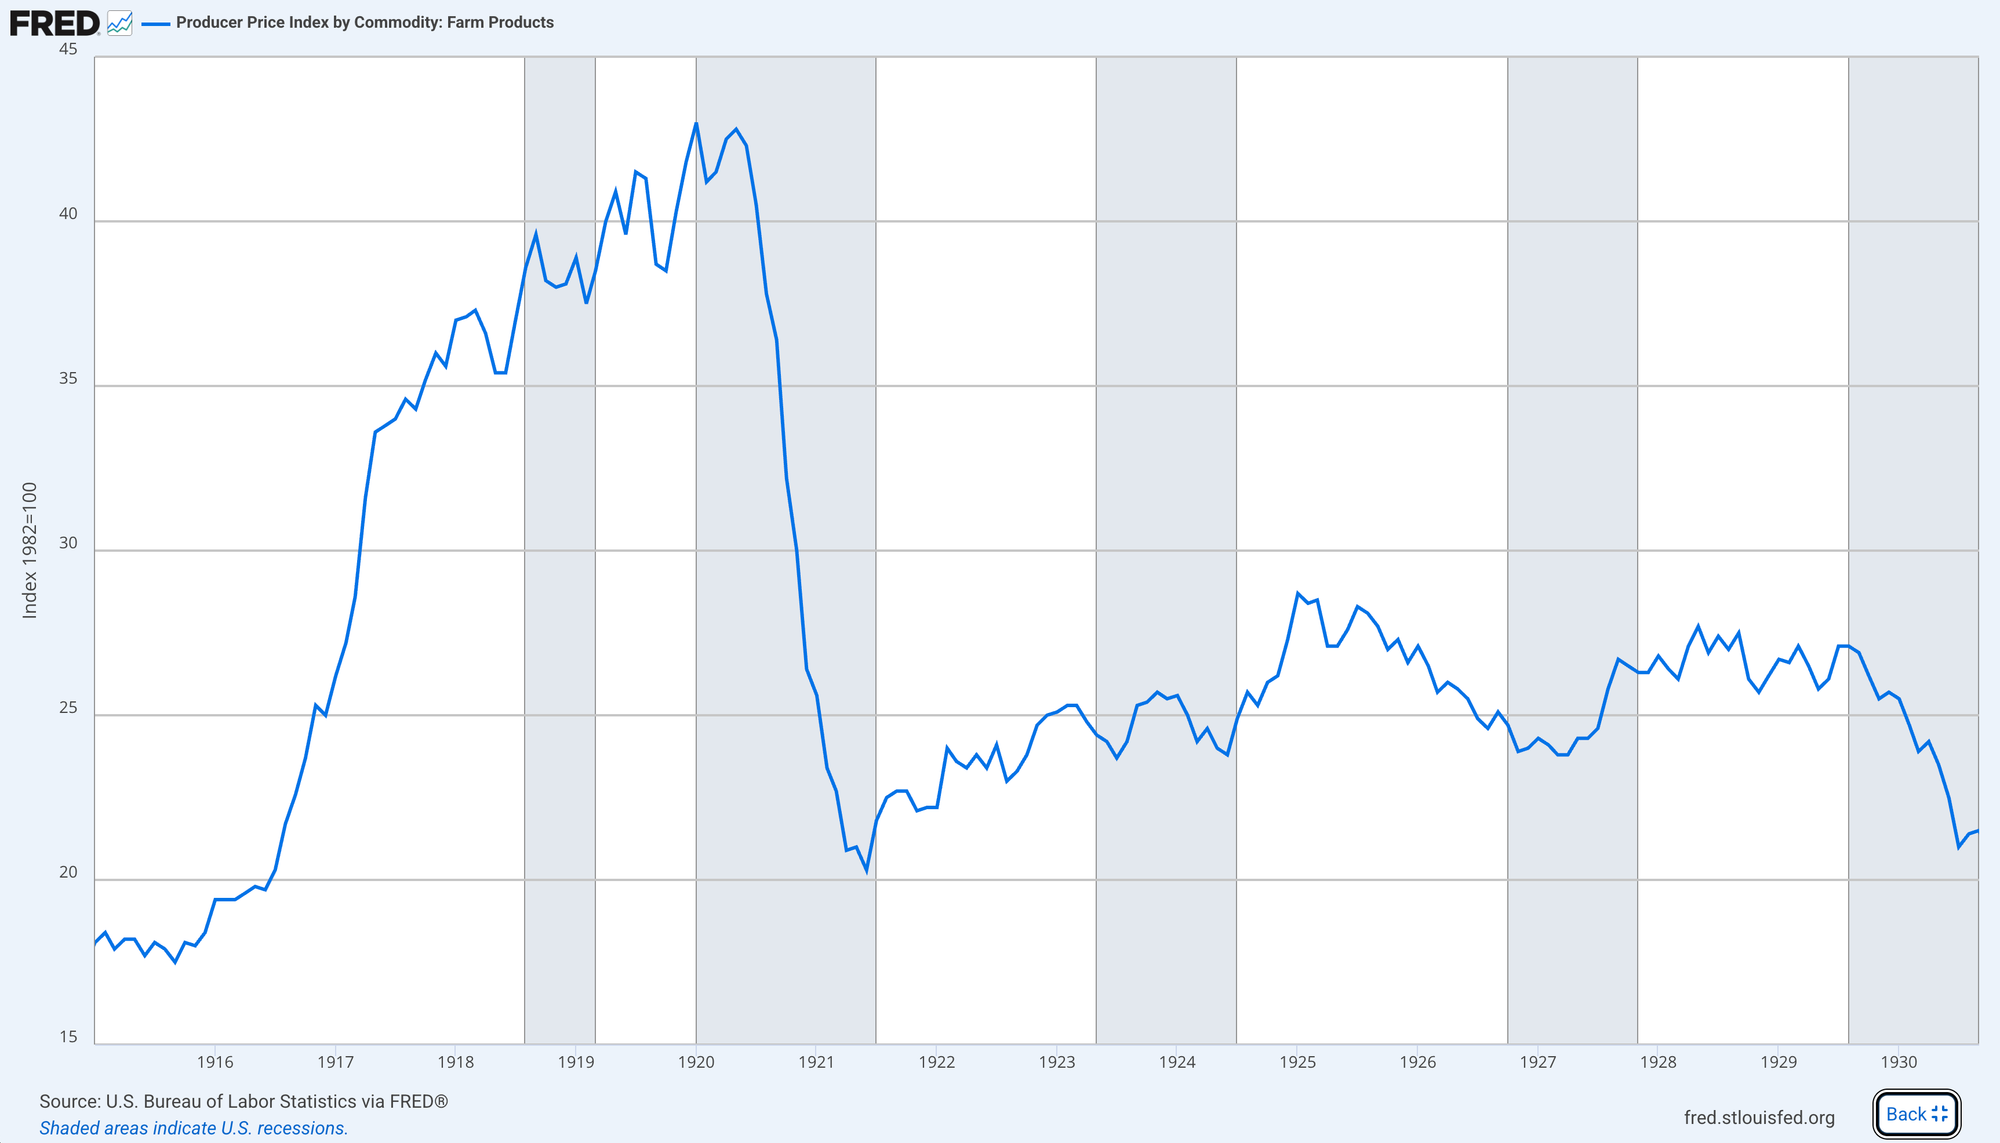
Looking at overall economic activity, from 1922 (following a deep, forgotten recession in 1920-21) GDP grew at an average annual rate of roughly 4.7% with GDP per capita increasing by 30% over the course of the decade.
While manufacturing productivity boomed, unemployment was exceptionally low following the economic recovery which began in 1922, with the unemployment rate dropping to 2.4% in 1923 and remaining between 3% and 4% for the remainder of the decade. Agriculture and manufacturing experienced dramatic direct impacts of productivity growth. In agriculture, mechanization created a supply boom leading to the collapse of commodity prices. Employment within manufacturing stagnated (employing roughly 10 million workers at the start and end of the decade) as demand for newly manufactured progress could not keep pace with the staggering gains in output. Meanwhile the services sector expanded dramatically creating 3 million new jobs throughout the decade.
Baumol's Cost Disease
In the 1960's the economist William Baumol observed one of the knock-on effects of the manufacturing boom in advanced economies as wages rose across the board (not just in the sectors enjoying technological innovation), a phenomenon called the "cost disease" of services. The intuition is simple: a string quartet requires four musicians to perform a Mozart piece today just as it did in 1820. You can't speed up the performance without ruining it. The productivity of the quartet is fixed.
But the wages of musicians must rise over time, because otherwise they'll quit and go work in manufacturing, where productivity is improving and wages are rising accordingly. The result is that the relative price of string quartet performances (and education, and healthcare, and legal services, and haircuts) rises inexorably, even as manufactured goods get cheaper.
The macroeconomic implications will be familiar to everyone. As economies shift from manufactured goods to services (roughly 80% of US GDP today), aggregate productivity growth declines mechanistically. GDP growth rates tell the story:
- 1950s-1960s: Average growth above 4%
- 1970s-1980s: Approximately 3%
- 2010s-recently: Below 2%
The Baumol effect is one of the most satisfactory explanations for the slowdown in productivity growth the developed world has experienced since the 1960s. However, the proliferation of AI technology has several characteristics which combined might possibly reverse secular stagnation.
Why AI Is Different (And Why It Might Work)
AI can automate cognitive labor. It can use software, write emails, merge spreadsheets, analyze x-rays, perform medical diagnoses, and create digital images. This is categorically different from robots, assembly lines, and tractors, which replaced elements of physical work (giving us synthetic muscle and scope to leverage thinking) and increased manufacturing productivity but have not touched services. AI systems target precisely where the economy has shifted to and substitute Capital (K) for Labor (L) in knowledge work.
Consider the case of a doctor who spends 40% of their time on documentation (a string quartet problem). An LLM does the documentation instantly; suddenly the doctor's output per hour doubles and very soon (the technology is already here) an AI model performs the diagnosis itself.
As AI turns services into software, the business dynamics of most of the economy will change. Software's marginal cost is de minimus. Services businesses have high marginal costs. If legal advice becomes code, the cost of a contract drops from $5,000 to $0.05 (request for startups: an AI law firm operating in one of the regulatory sandboxes in Utah or Arizona that can write contracts, enforce with humans in the loop, and embeds malpractice insurance, please get in touch).
This appears in our growth accounting framework in two ways (1) capital deepening: we are going to spend a lot of money on GPUs and data centers (the growth rate of K increases) and (2) productivity bonanza: instead of doctors visiting patients, recording their symptoms, and making a diagnosis by hand, patients will interact with an AI system which makes a diagnosis monitored by a physician who adjudicates edge cases, gives second opinions (assisted by different AI systems), and probably delivers bad news (and serves a lot more people than before). Fortunately for doctors, I suspect America's hypochondria will allow demand to keep pace with supply (I expect people to get a lot more units of medical care for the same dollars and for real wages for doctors that see patients to increase).
The Consensus View (2% GDP Growth Over the Next Decade)
Before we examine what the "Roaring 30's" could look like, here's what the consensus estimates for GDP growth over the next decade from organizations like the Fed and Goldman Sachs (roughly 2% growth).
Labor growth averages around 0.4% (unless America shifts its immigration stance dramatically or we supplement organic brith rates with synthetic wombs this is fixed and likely to continue to trend downward if anything).
Capital contribution averages around 0.8% (we build more data centers).
TFP growth stays around 0.8% (essentially on our current trend line).
This view assumes that the next decade is going to be a slightly better version of the 2010s: plenty of data center and robotics capex and the continued proliferation of increasingly better software throughout the economy.
The Roaring 30's (3.25% GDP Growth by the Numbers)
1.25% doesn't sound like much but its the difference between secular stagnation and the 1990s. By 2045, that's an $11T gap in GDP (roughly the size of Japan's economy) and an extra $30,000 of GDP per capita for the United States.
Labor growth remains at 0.4%.
Capital contribution jumps to 1.3%. To get from 0.8% to 1.3%, we can't just buy chips. We have to replicate the intensity of the 1990s. During the peak of the Telecom/Internet boom (roughly 1996–2000), tech investment swelled to ~1.7% of US GDP. We laid dark fiber across oceans and built server farms before we knew what "cloud" meant.
TFP growth doubles from 0.8% to 1.6% (the services sector gets a lot more productive as it adopts increasingly capable aI systems).
The electrification precedent suggests its plausible. Manufacturing TFP growth rates of 5%+ during the 1920s were sustained for a decade. Labor productivity growth of 5.1% annually, more than five times current rates was achieved within living memory.
That said, services, which currently account for ~80% of GDP with productivity growth near zero, would need to achieve manufacturing-like efficiency gains. Healthcare administration, legal services, financial planning, education, all the Baumol-afflicted sectors would need to undergo the kind of transformation that manufacturing experienced during electrification.
Capital Accumulation
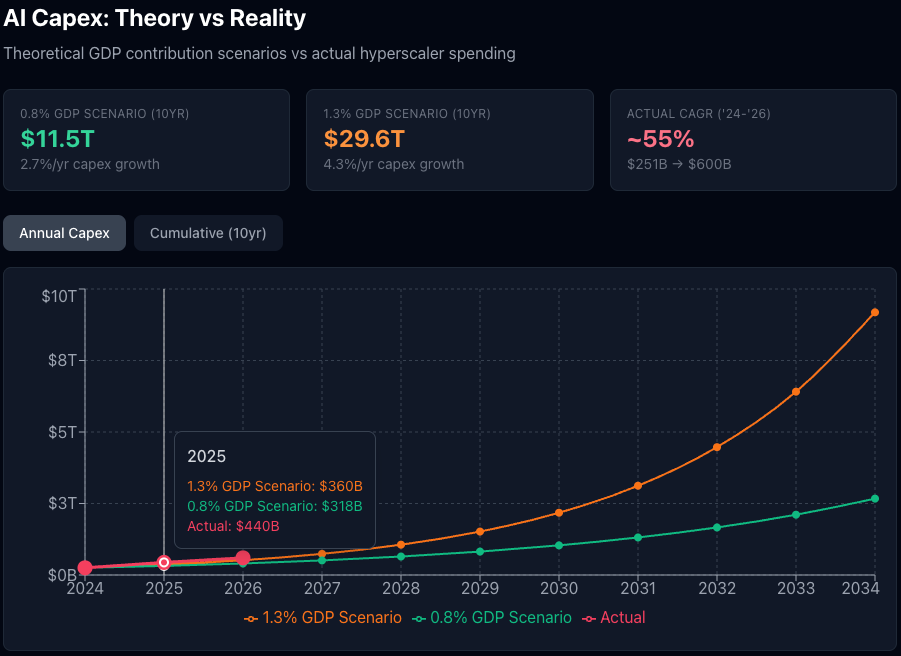
The hyperscalers (Amazon, Microsoft, Google, Meta, Oracle) are spending at historically unprecedented rates:
- 2024: $241 billion (0.82% of GDP)
- 2025: $400–$500 billion estimated (1.3–1.7% of GDP)
- 2026: $600+ billion forecast (1.9–2.0% of GDP)
In Q3 2025, data center capex grew 59% year-over-year. The Big Four alone spent $113 billion in a single quarter, 75% higher than the year prior. Microsoft committed $80 billion for FY2025. Amazon is on track for $125 billion. Meta raised guidance to $64–$72 billion.
A few observations:
The chart above shows the divergence in the absolute levels of AI capex required to contribute 1.3% a year to GDP growth (vs the consensus estimate of 0.8%) starting from a base of $251 billion in 2024. What's remarkable is that we are already well ahead of any optimistic AI infrastructure investment schedule.
Second, we're not at peak 1990s levels yet. IT investment rose from 3% of GDP in 1991 to nearly 5% by 2000, capturing 40–45% of all equipment and software investment at the bubble's apex. AI capex at 1.3–2.0% of GDP is significantly larger than the broadband bubble, but still below the full 1990s IT boom.
Third, the trajectory matters more than the level. AI capex has roughly doubled as a share of GDP in two years. Consensus estimates have been revised upward every quarter. Analysts projected $250 billion for 2025 at the start of 2024; we were well north of $400 billion. If this pace continues, we'll hit 1990s IT levels by 2027–2028.
Fourth, the "Energy Multiplier" distorts the chart. In 1999, when Cisco built a router, they didn't have to build a power plant to run it. Today, for every $1 spent on a GPU, roughly $0.60 is being spent on energy infrastructure (liquid cooling, copper, SMRs, grid upgrades).
If we hit the $600 billion mark in 2026, we aren't just matching the 1990s infrastructure build; we are exceeding it in capital intensity. That is how you get to a capital contribution of 1.3%. You build the intelligence factory.
Infrastructure vs. Adoption: The Critical Distinction
There's a category error lurking in the capex comparison that's worth making explicit. Technology investment booms can come in two flavors:
Infrastructure buildout: A handful of companies build the pipes, railroads, fiber optic cables, data centers: concentrated capital formation by suppliers.
Broad-based adoption: Millions of businesses buy equipment to use the infrastructure, PCs, software, factory equipment. This is dispersed capital formation by users.
The 1990s had both, sequentially. Telecom companies laid fiber (infrastructure), then every business in America bought PCs and SAP licenses (adoption). The current AI boom is almost entirely the former.
| Type | Boom | Peak (% GDP) | Players |
|---|---|---|---|
| Infrastructure | Telecom (1996-2001) | ~1.05% | WorldCom, Global Crossing, AT&T |
| Infrastructure | AI (2024-present) | 1.3-2.0% | 5 hyperscalers |
| Adoption | IT/Internet (1995-2000) | 4-5% | Every business in America |
| Adoption | AI (2025-?) | ~0.3-0.5%? | Early Innings |
On an apples-to-apples basis, AI infrastructure spending has already exceeded the telecom bubble. We're not in uncharted territory, but we're in "this is a very big deal" territory.
The Roaring 30's scenario requires the adoption wave to kick in. We should see healthcare systems replacing billing departments with AI, law firms restructuring around AI-leveraged associates, and financial advisors serving 5x the number of clients. That broad-based adoption is still early (though I have plenty of anecdotal evidence from the clients my portfolio companies are serving that this is underway and the models are good enough to make a dent, fast).
What Has to Go Right (Hypothesis Testing)
Optimism is cheap. The steel-man case for AI-driven growth acceleration is only useful if we can specify conditions under which we'd abandon it. Here's the falsification framework.
Macroeconomic Indicators (Watch These by 2030)
TFP Growth: Sustained TFP growth at or above 1.5% annually for 8+ quarters (check the BLS quarterly releases).
Labor Productivity in Services: Professional services productivity growth swells to more than 2.5% annually. Labor productivity grew a staggering 4.9% in Q3 of this year, some of that is likely a rebasing from what one could call a mini-recession in Q2, watch out if this persists!
The Solow Paradox Redux: The electrification parallel suggests a 5-10 year lag between capital deployment and productivity surge, but we should see something by then. It wasn't until the 1920's that 50% of factories ran on electric motors which coincided with the surge in productivity. The groundwork began in the 1910's with early adopters and the redesign of factory layouts.
Sectoral Metrics (The Leading Indicators)
Healthcare:
- Administrative costs as % of total spending declining (currently ~30%)
- Revenue per physician rising >4% annually
- Insurance claim denial rates falling (AI pre-authorization)
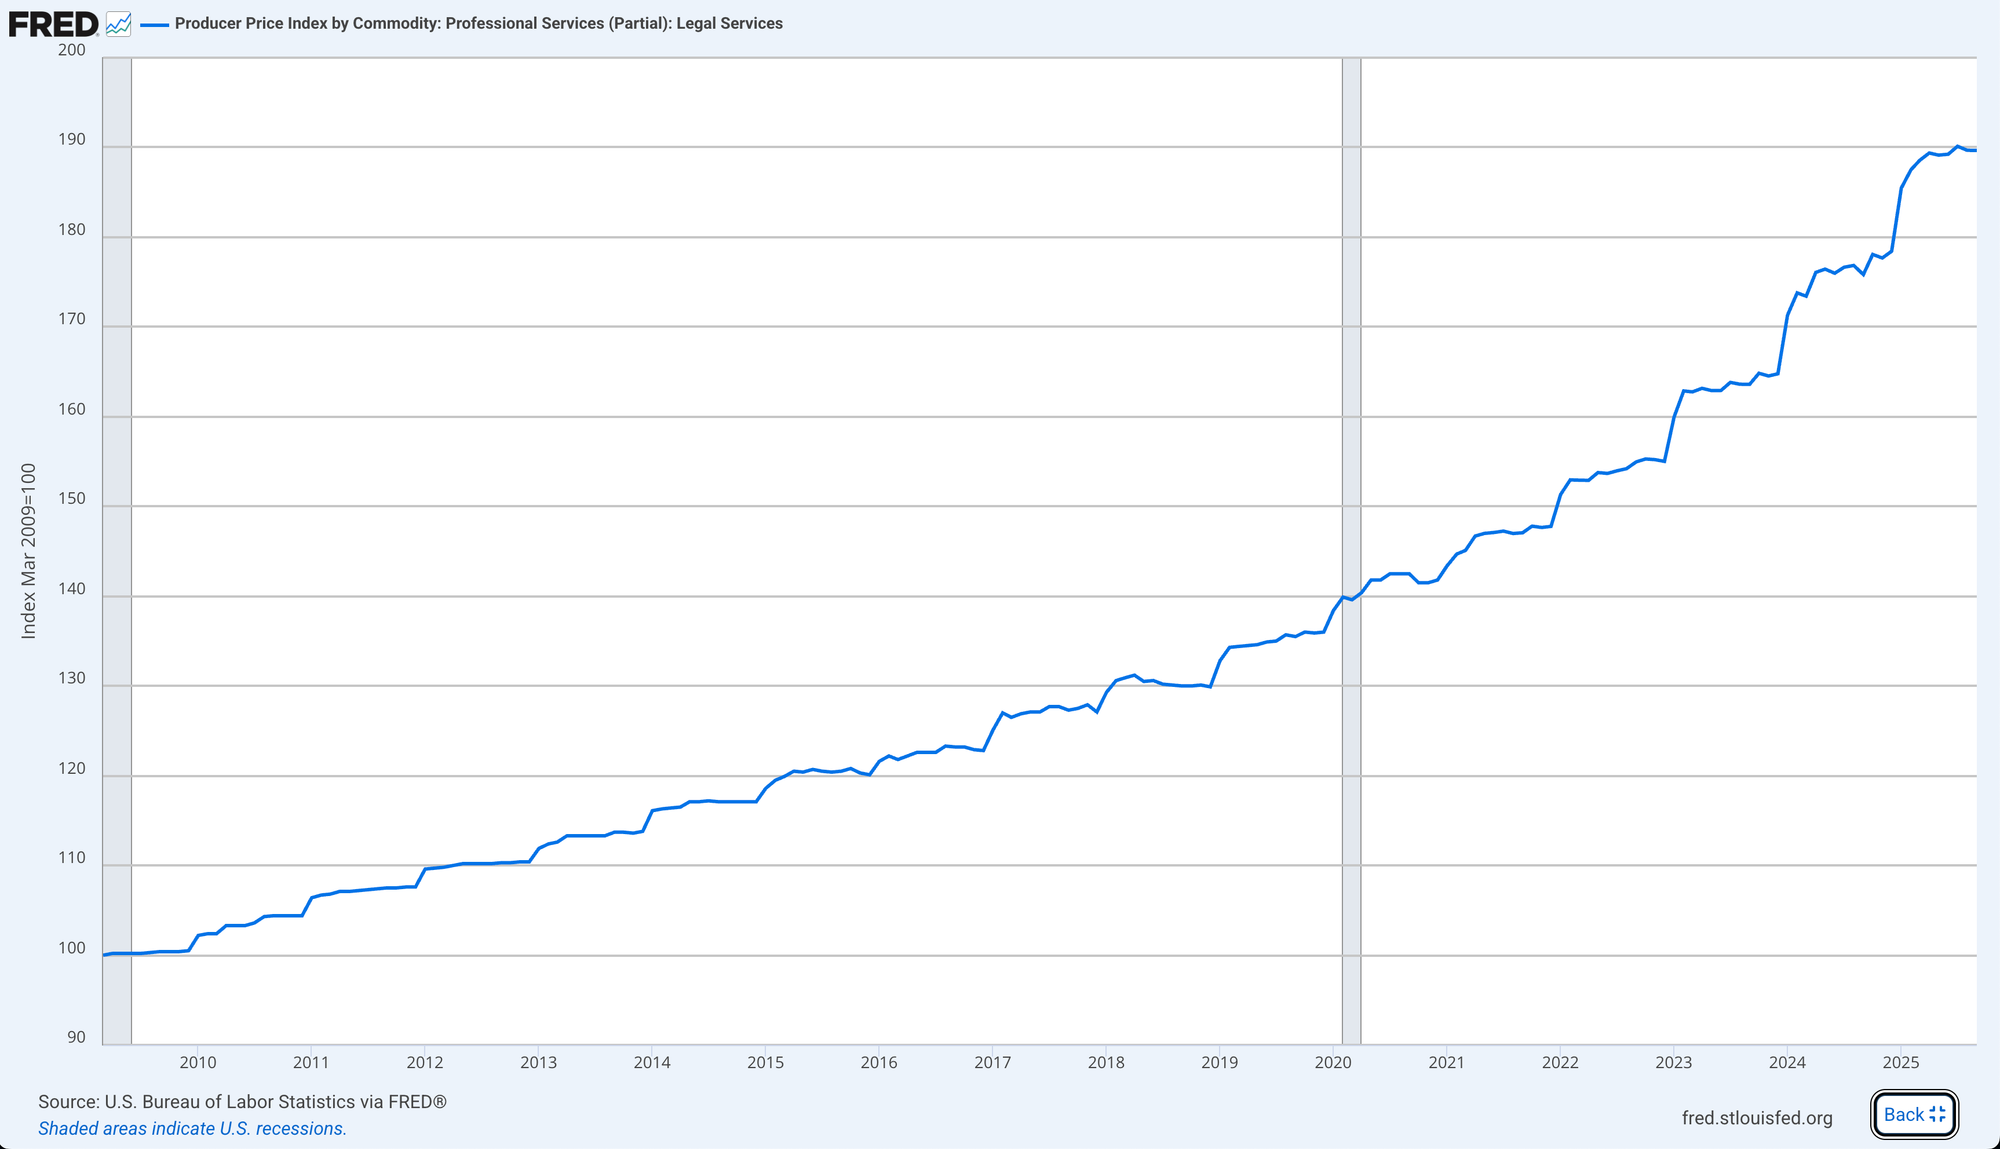
Legal Services:
- Revenue per lawyer increasing >10% annually
- Associate-to-partner leverage ratios increasing
- Contract review costs falling 50%+ for standardized work
Financial Services:
- The cost of setting up and administering trusts and other tax-advantaged structures falls precipitously
- Assets under management per advisor rising 3x
- Compliance costs as falling by double-digit percentages annually
If these sectors show no measurable productivity improvement by 2030 despite widespread AI tool adoption, the Roaring 30's thesis is probably wrong.
Market Signals (What Prices Are Telling Us)
Equity Markets:
The stock market is telling us something about expected productivity gains through relative valuations:
- AI infrastructure (Nvidia, cloud providers): Priced for perfection. 40-60x earnings assumes the build continues.
- Enterprise software with AI integration: 15-25x revenue for leaders. Market expects productivity gains to flow through.
- Traditional professional services (legal, accounting): Flat to down. Market skeptical these firms capture the gains vs. get disrupted.
If the Roaring 30's thesis is correct:
- Early-adopters of AI technology will be the only ones to survive in competitive services industries.
- Businesses with a strong brand and franchise should able to maintain pricing power (for a while anyway) and pass along savings to their shareholders in the form of increased earnings.
- AI-native service businesses (the ones that don't exist yet) should be the big winners with new business models that reflect a completely different cost structure.
Fixed Income:
The bond market is the real test. If AI drives sustained 3.25% growth:
- 10-year Treasury yields should settle at 4.5-5.5% (vs. ~4.3% today).
- TIPS breakevens should rise to 2.8-3.2% as growth outpaces inflation.
- Investment-grade spreads should compress for AI beneficiaries.
If the bond market doesn't move despite equity enthusiasm, the smart money is betting against the growth thesis.
Employment
Technological transformations redistribute economic gains unevenly and AI will be no different in that regard. What I suspect will be different this time is that while past technological advances always increased the economic returns to thinking at the expense of economic returns to physical dexterity and strength allowing individuals to move up the economic value chain. AI systems already outperform knowledge workers on a variety of tasks. Are there enough managerial jobs to absorb them? Not likely. One scarcely imagines that these folks (including yours truly) would gush at the opportunity to become an HVAC tech in a data center (assuming I could learn the necessary skills faster than Elon's Optimus robots).
The 1920s Parallel (What Actually Happened)
Electrification didn't cause mass unemployment. It caused mass reallocation:
- Manufacturing employment: Flat at ~10 million (productivity absorbed demand growth)
- Agriculture: Collapsed as mechanization cratered commodity prices
- Services: more than 3 million new jobs over the decade
- Unemployment: 2.4-4% throughout the boom
The workers who prospered weren't the same workers who were displaced. Artisanal craftsmen gave way to assembly-line operators. The skills that commanded premium wages in 1890 were worthless by 1925.
The AI Version (Best Guess)
If the Roaring 30's scenario materializes:
Declining employment (absolute terms):
- Administrative/clerical: -40-50%
- Customer service: -60-70%
- Routine legal/paralegal: -30-40%
- Basic financial analysis: -50-60%
Stable or growing:
- Healthcare delivery (non-administrative): +20-30%
- Skilled trades: +10-20%
- Technical/engineering: +30-50%
- AI operations/oversight: +200-300% (from a low base)
- The "new" AI economy+++: jobs that weren't possible without AI and services that we couldn't afford or didn't know we needed until we're years into this productivity boom (Vine was founded at least half a decade before social media influencers were a thing).
The distribution matters enormously. The 1920s boom was followed by the 1930s bust partly because productivity gains accrued to capital while displaced workers couldn't find new roles fast enough (skilled engineers and managers flourished during the depression years as real incomes increased drastically). Low-skilled labor faced the coal furnace of increasing productivity and insufficient aggregate demand (which the banking crises didn't help).
If AI productivity gains flow primarily to hyperscalers and high-skill workers, I will confidently (and unhappily) predict that we will see social instability regardless of GDP growth. I don't think it would be controversial to suggest that this appears to be the path we are on and I believe we are likely to experience more not less political violence in the years to come.
I firmly believe (based on the historical record) that gratifying jobs that people want to do more than clerical work will emerge as a result of AI proliferation that we (or at least one with my modest intelligence) can't imagine, just as "social media manager", "influencer", and "data scientist" didn't exist as professions in 2005.
Conclusion
I began scribbling away on some of these ideas last summer without a conclusion in mind (which will surprise no one who's made it this far). I suppose I have been trying to steer a middle ground between the skeptics and the singularity-pilled using some basic arithmetic to navigate with. As a child of the 90s (and one who is enjoying the resurgence of the decade's aesthetic), I am delighted that there is a future which is both achievable and optimistic based on historical precedent and lived experience. While inflationary political forces as well as the risks of pauperization for many kinds of workers are real, the corresponding wealth that our nation will be able to produce in aggregate will put us in a position to address these issues peacefully (if we so choose).
DISCLAIMER: This post and the information presented are intended for informational purposes only. The views expressed herein are the author’s alone and do not constitute an offer to sell, or a recommendation to purchase, or a solicitation of an offer to buy, any security, nor a recommendation for any investment product or service. While certain information contained herein has been obtained from sources believed to be reliable, neither the author nor any of his employers or their affiliates have independently verified this information, and its accuracy and completeness cannot be guaranteed. Accordingly, no representation or warranty, express or implied, is made as to, and no reliance should be placed on, the fairness, accuracy, timeliness or completeness of this information. The author and all employers and their affiliated persons assume no liability for this information and no obligation to update the information or analysis contained herein in the future.